Telco Churn Model (Expanded Dataset)
by L. Mark Coty
In this process, we make use of an expanded version of the Telco Churn dataset, which contains 33 columns. It is linked here.
GitHub repository here. Run the notebook.
A number of columns were dropped:
Count: These all = 1.
Country: These all = US.
State: These all = California.
Lat Long: This duplicates the latitude and longitude columns.
Latitude: This is too specific to be useful.
Longitude: This is too specific to be useful.
Churn Label: This duplicates churn value.
Churn Score: Unclear meaning
CLTV: Unclear meaning
Churn Reason: Too many distinct natural language values
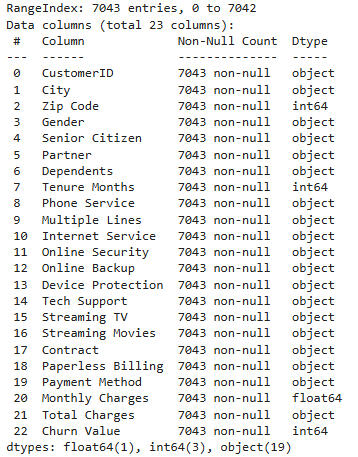
The resulting data columns, counts, and types are shown here:
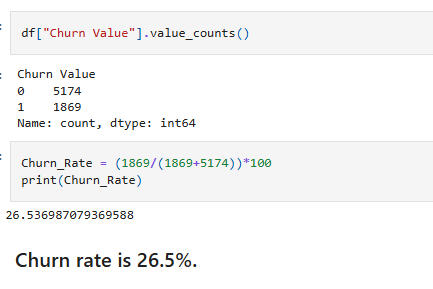
Calculate the churn percentage:
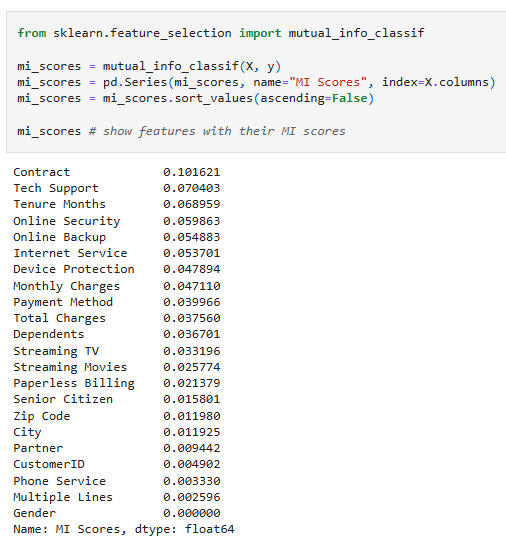
Find and Visualize Mutual Information Scores:
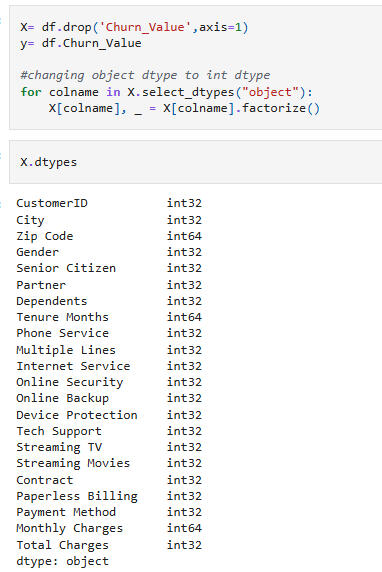
Convert data types and separate target variable:
Show features with their MI scores:
Plot the MI scores:
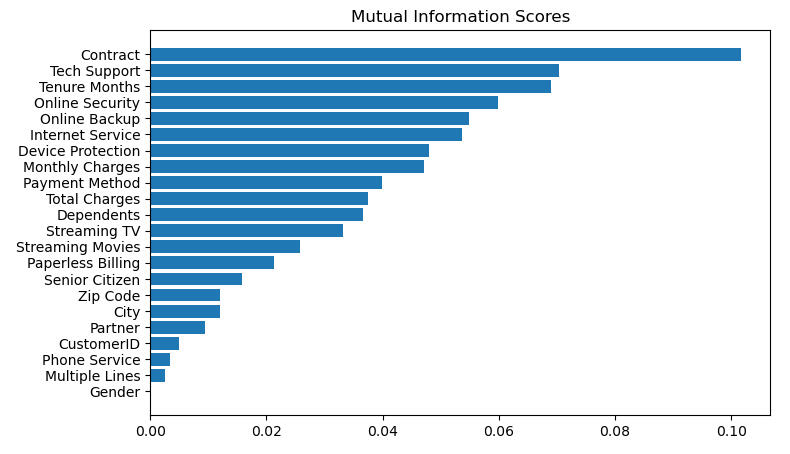
As expected, the presence of a contract has the largest impact on churn.
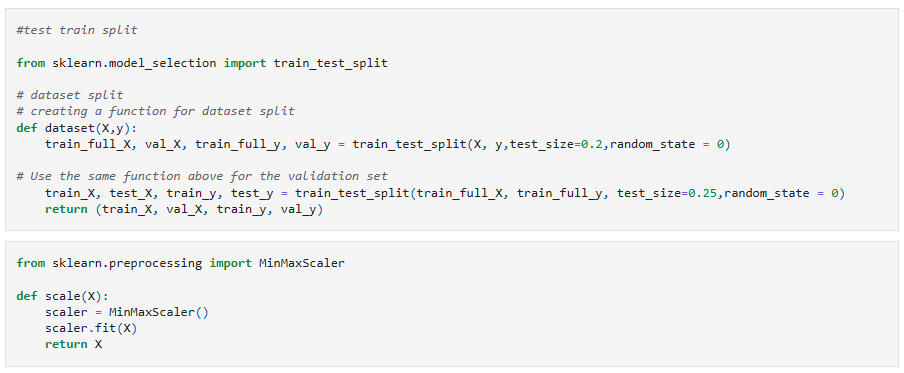
Prepare Models
Models:
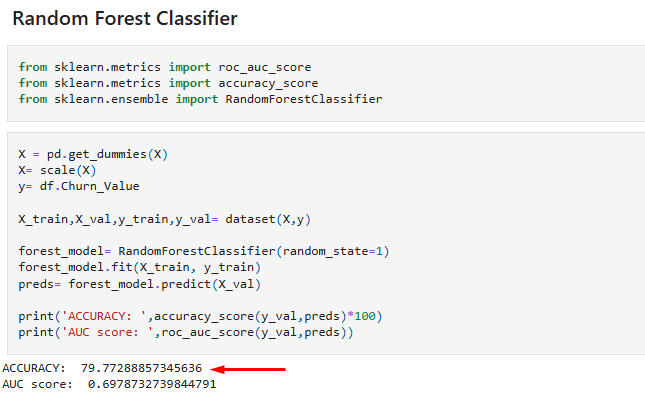
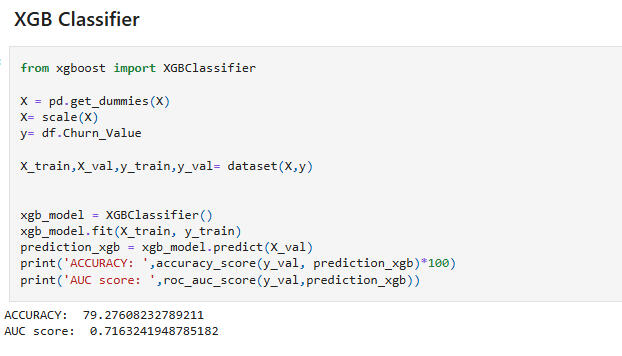
Conclusion: The XGB Classifier model is preferred, since its accuracy is nearly equal to the RF Classifier model's, but its AUC score is above the 0.7 threshold. However, the two models are nearly indistinguishable in quality.
Perform cross-validation:
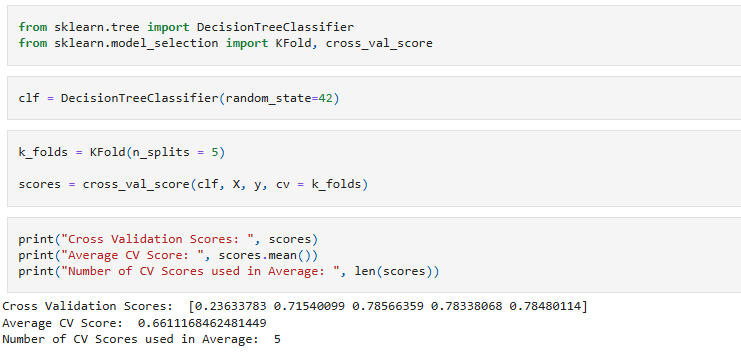
Conclusion:Fold scores:
Lowest = 0.2363 (≈23.6%)
Highest = 0.7857 (≈78.6%)This is a very wide spread. One fold is nearly random / poor, while the others are decent. This indicates that the models are inconsistent across folds.Possibly, the dataset has class imbalance, different distributions in folds, or small sample size in some folds.